Project Description
This is a personal project I developed to test and apply my data analysis knowledge. Built using Flask and PostgreSQL, the web application allows users to input their weekly income and expenses via an HTML form. The data is securely stored in a PostgreSQL database, and the app calculates savings while providing an expense breakdown by category, offering users a comprehensive view of their finances.
To further enhance the project, I integrated Power BI for interactive visualisations, displaying income trends, expense categories, and monthly savings goals. This project was an opportunity to turn theoretical knowledge into a practical, fully functional tool, combining web development, database management, and data visualisation in a single application.
Why I Built this Project
I developed this project to track my finances by recording weekly income and expenses, and displaying the results in a dashboard for clear financial insights. The goal was to create a user-friendly system where data could be entered through an HTML form, stored securely in a PostgreSQL database, and then visualized in a Power BI dashboard. This project not only serves as a practical tool for managing finances but also demonstrates my ability to integrate backend data with interactive visualisations, offering valuable insights into income, expenses, and savings.
Project Details
| Project Details | Descriptions |
|---|---|
| Date | April 2025 |
| Type | Personal Project |
| Tech Stack | Flask (Python), PostgreSQL, HTML, Power BI |
| Backend | Flask (app.py) |
| Frontend | HTML (register.html, login.html, dashboard.html) |
| Database | PostgreSQL |
| Data Input | HTML forms for income and expense entries |
| Visual Insights | Total income, total expenses, savings, Expense by Categories, Income VS Expense, Weekly Hours, Total Hours Worked |
Screenshots
Login Page
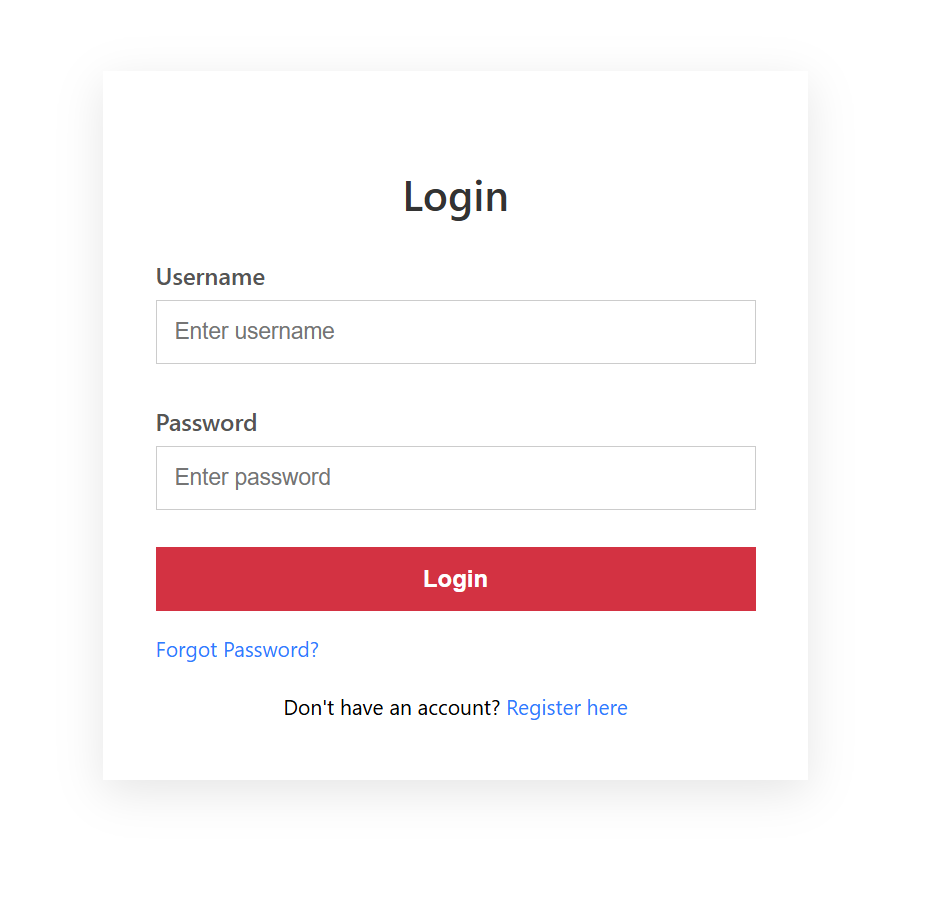
The login page is a simple and clean interface that allows users to access the Income Tracker application. It includes fields for username and password, styled with responsive and modern CSS. Users can also navigate to the registration page or reset their password through helpful links provided on the page.
Register Page
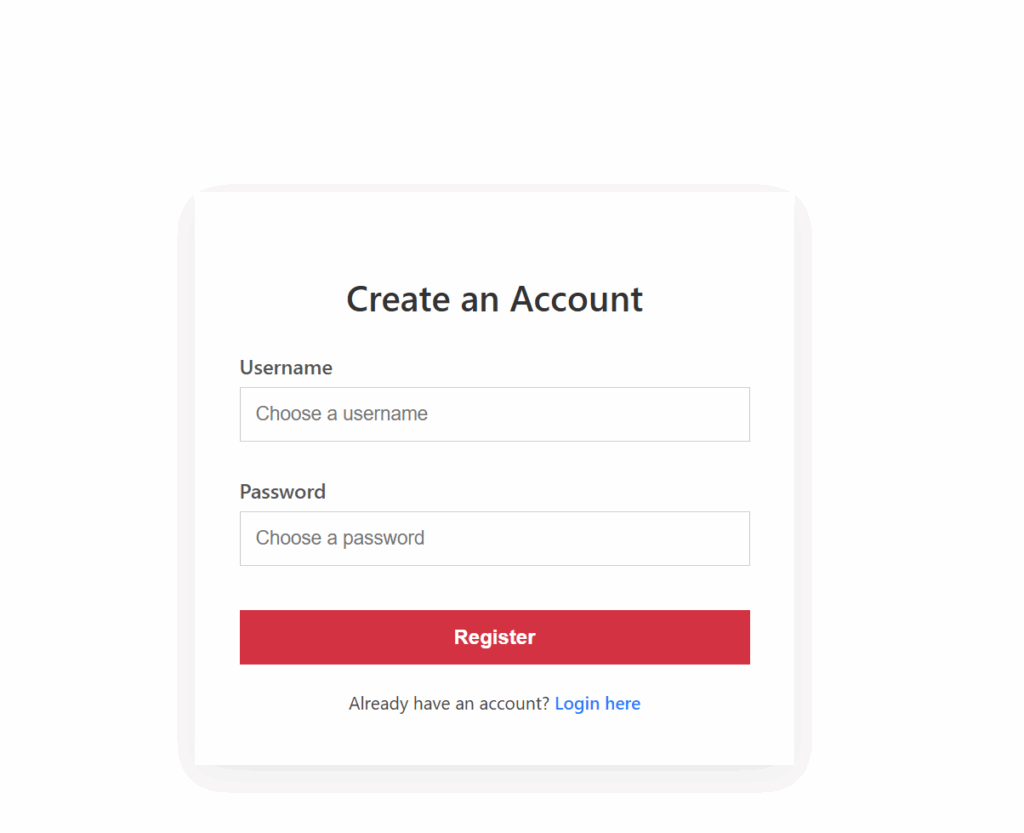
The registration page features a clean, user-friendly layout with fields for entering a username and password. Styled with a modern design, it ensures a smooth onboarding experience. While basic, it currently focuses on core functionality without additional validations or error handling.
Power BI Data Model Overview
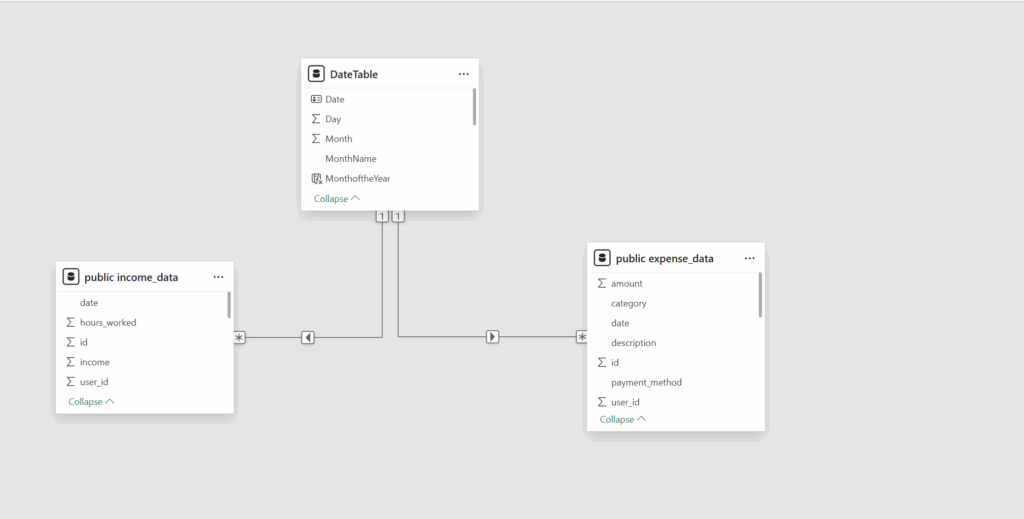
The data model follows a star schema structure centered around a DateTable, which acts as the primary time intelligence dimension. It connects to two fact tables: public.income_data and public.expense_data.
🔗 Relationships:
-
One-to-many relationship from
DateTable[Date]to both:-
public.income_data[date] -
public.expense_data[date]
-
-
The model enables consistent time-based analysis across income and expense datasets.
-
Each fact table includes a
user_idfield supporting multi-user data filtering and future personalisation.
This clean, efficient schema ensures optimized performance for DAX measures, facilitates easy time slicing (by day, month, year), and supports scalable reporting in your financial dashboard.
Finance Tracker Dashboard Overview
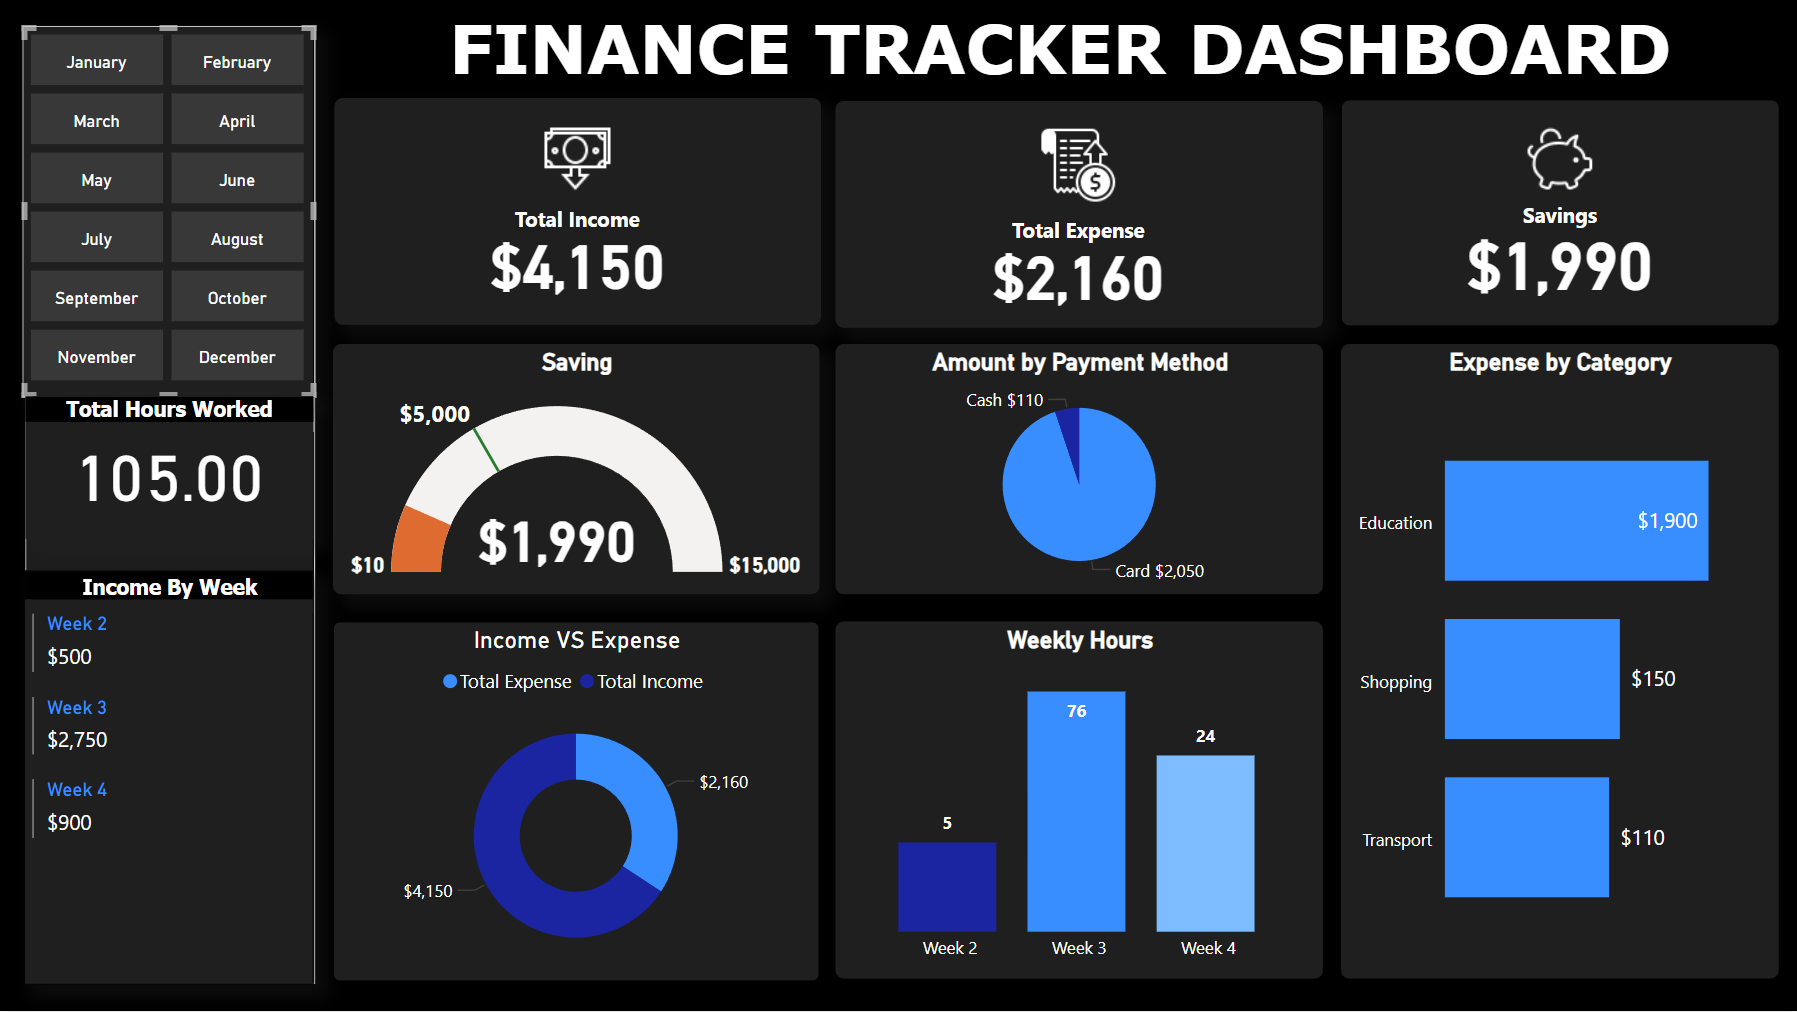
This Power BI dashboard provides a comprehensive overview of income, expenses, and savings using dynamic visuals.
Key Features & Visuals:
-
Top Metrics Display:
-
Total Income
-
Total Expense
-
Savings (automatically calculated as income minus expense)
-
Total Hours Worked
-
-
Income by Week: A visual breakdown of weekly income trends, helping users identify high and low-earning periods.
-
Savings Goal Tracker: A dynamic donut gauge shows progress toward a predefined savings goal, encouraging better financial discipline.
-
Payment Method Breakdown: A pie chart categorizes expenses based on how payments were made (e.g., cash, card, etc.).
-
Expense by Category: A bar chart highlights how spending is distributed across categories such as education, shopping, and transport.
-
Income vs. Expense Comparison: A dual-ring chart visually contrasts income with expenses, making it easy to assess financial balance.
-
Weekly Hours Worked: A column chart tracks the number of hours worked each week, offering insight into labor input relative to income earned.