Project Description
This project showcases five interactive dashboards developed using Power BI, created as part of my Data Analytics assessment during the third semester of my Master of Business Information Systems (MBIS) program. Each dashboard is based on an analysis of a provided Sales Assessment Dataset and focuses on delivering clear, actionable business insights through data visualisation.
The dashboards include:
-
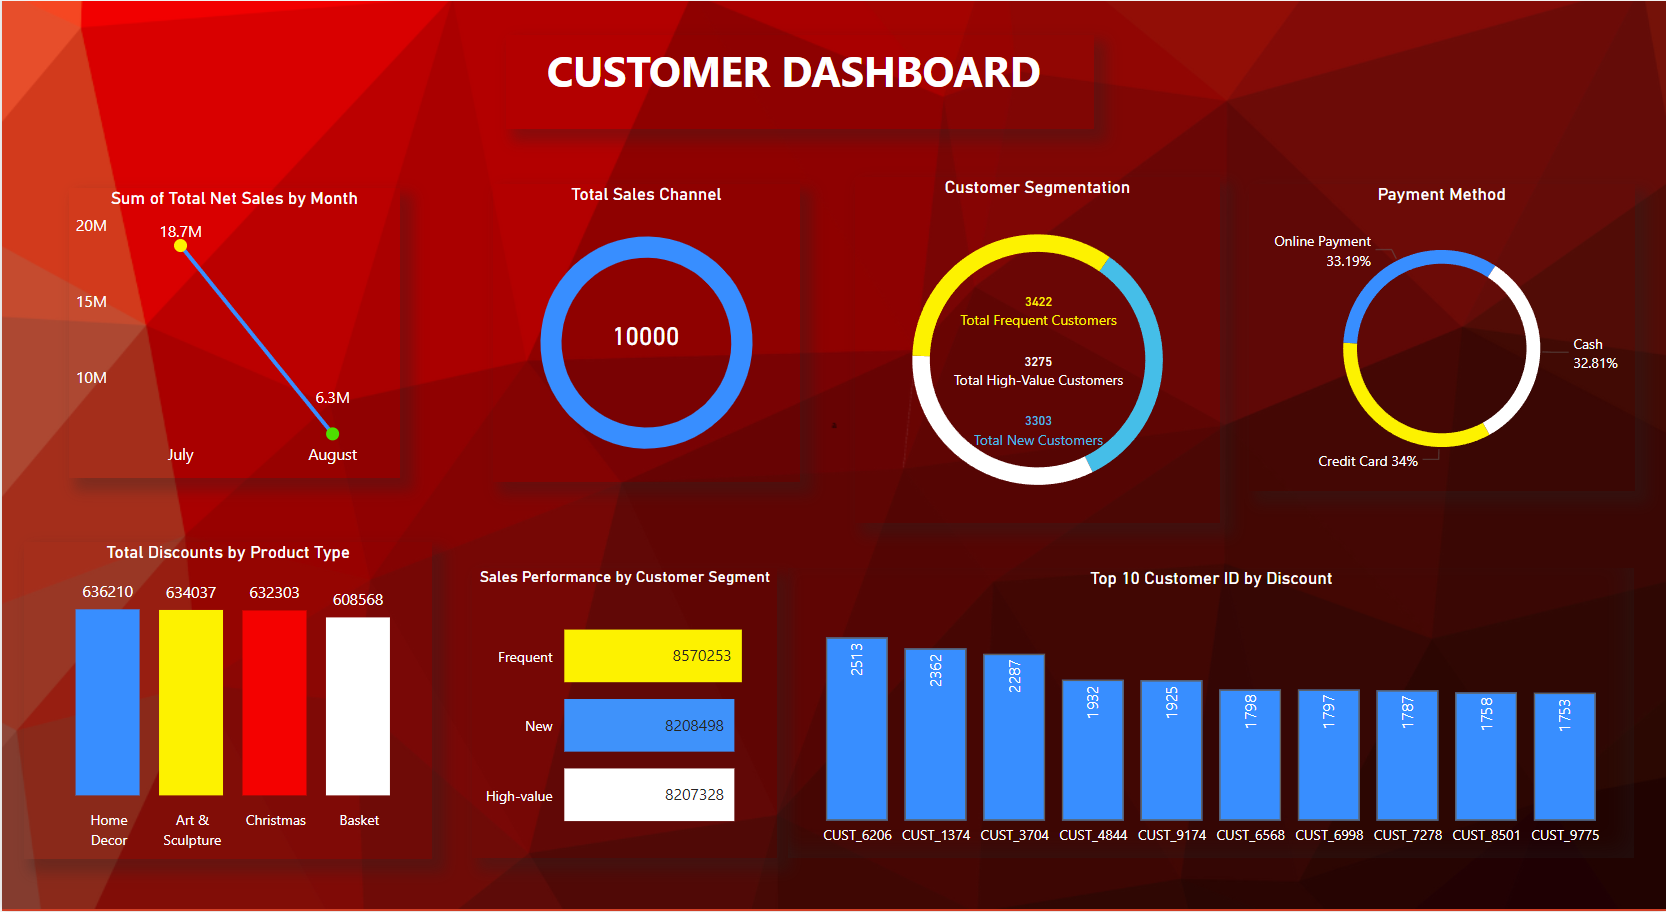
Customer Analysis Dashboard: A deep dive into customer behaviour and purchasing patterns.
-
Salesperson Dashboard: Individual performance metrics for each salesperson.
-
Time Trend Dashboard: Sales performance over time, identifying seasonal trends and growth patterns.
-
Performance Evaluation Dashboard: Comparative analysis across salespeople and products.
-
Sales Analysis Dashboard: Overall sales performance with KPIS and breakdowns across regions and categories.
Through this project, I combined technical Power BI skills with business analysis, translating raw data into compelling visual stories that support strategic decision-making.
Why I Built This Project
I developed these dashboards as part of an academic assessment designed to simulate real-world data analysis scenarios. The primary goal was to transform raw sales data into interactive visualisations that provide key insights for business stakeholders.
By working on different themes like customer segmentation, time-series trends, and performance metrics, I strengthened my ability to build analytical dashboards that not only summarise information but also guide business strategies. This project also reflects my proficiency in Power BI, data interpretation, and dashboard storytelling — skills essential for any data analyst role.
Project Details
| Project Details | Description |
|---|---|
| Date | September 2024 |
| Type | Academic Project (Assessment) |
| Tech Stack | Power BI, PostgreSQL |
| Backend | Data imported directly into Power BI |
| Frontend | Power BI Dashboards |
| Database / Data Source | Assessment_Sales_Dataset.csv (in the GitHub link) |
| Data Input | Static CSV file upload into Power BI |
| Visual Insights | Customer Segmentation, Salesperson Performance, Sales Time Trends, KPI Dashboards, Product and Category Analysis |

